

By David J. Mooney, M.D.
There were two nutrition/lifestyle based studies in the past week which made national headlines, but the eye-catching headlines did not match up with the data from the trials. It seems like these headlines pop up each month. Fill in the blank associated with cancer risk/mortality/immortality! I (Dr. Mooney) wanted to look at these published trials (as opposed to the media conclusions) to see how legitimate these two specific headlines were. These kind of trials are always tricky to interpret, hopefully this can help others be able to filter these headlines a little better when the next one comes up another month. Let’s take a look at each one…reminder that these are my own opinions and not medical advice.
Eye Catching Headline #1
Low carb diets may cut years off life
Link to the article here.
Fun quotes:
“Those who lived longest tended to eat a diet consisting of 50% carbohydrates.
“Those eating just 30% or less carbohydrates faced a life expectancy four years lower than the half carb group”
“This unravels a clear message: moderate carbohydrate intake of 50-55% of total energy, and not a low-carb diet, is optimal for longevity” quote from “independent scientist”!
Here is a link to the published article in Lancet (a medical journal).
My take #1: This data accumulation took place over 30 years with over 15,000 people. The trial only monitored those people’s carbohydrate consumption on 2 questionnaires. One in 1987 and one in 1993. How accurate are two static questionnaires at arbitrary time points to evaluate a person’s nutrition habits over 30 years? Those two questionnaire results were then extrapolated out and compared to the mortality rates, assuming that a person’s nutrition habits did not change over 30 years.
My take #2: This trial was designed to look at association not causation. The researches said this in the first line of the trial. This is the difference between saying “Someone who has A is more likely to have B” and saying, “Someone with A has caused an increase in B”. In order to know A causes B, you have to have everything else the same that could possibly influence B. That’s why we randomize trials on drugs and their outcomes to try and isolate only one variable that is changed between the two sides. In a nutrition trial over 30 years (and many other trials looking at long-range outcomes), you really can’t randomize people to one particular diet or the other and keep them that way. So that one particular measured variable (like carbs consumption) cannot get isolated from other variables that may influence health outcomes that we aren’t going to measure.
For example, in this study, people that had low carb diets were more likely to be smokers (68% current or former smokers) versus people that had medium or high carb diets (58% and 51% current or former smokers, respectively). So the smoking history may be contributing to the “cutting years off life” that is getting measured as carb consumption. There are many research methods to try and account for these variables, but it makes the data much messier than it appears on CNN.
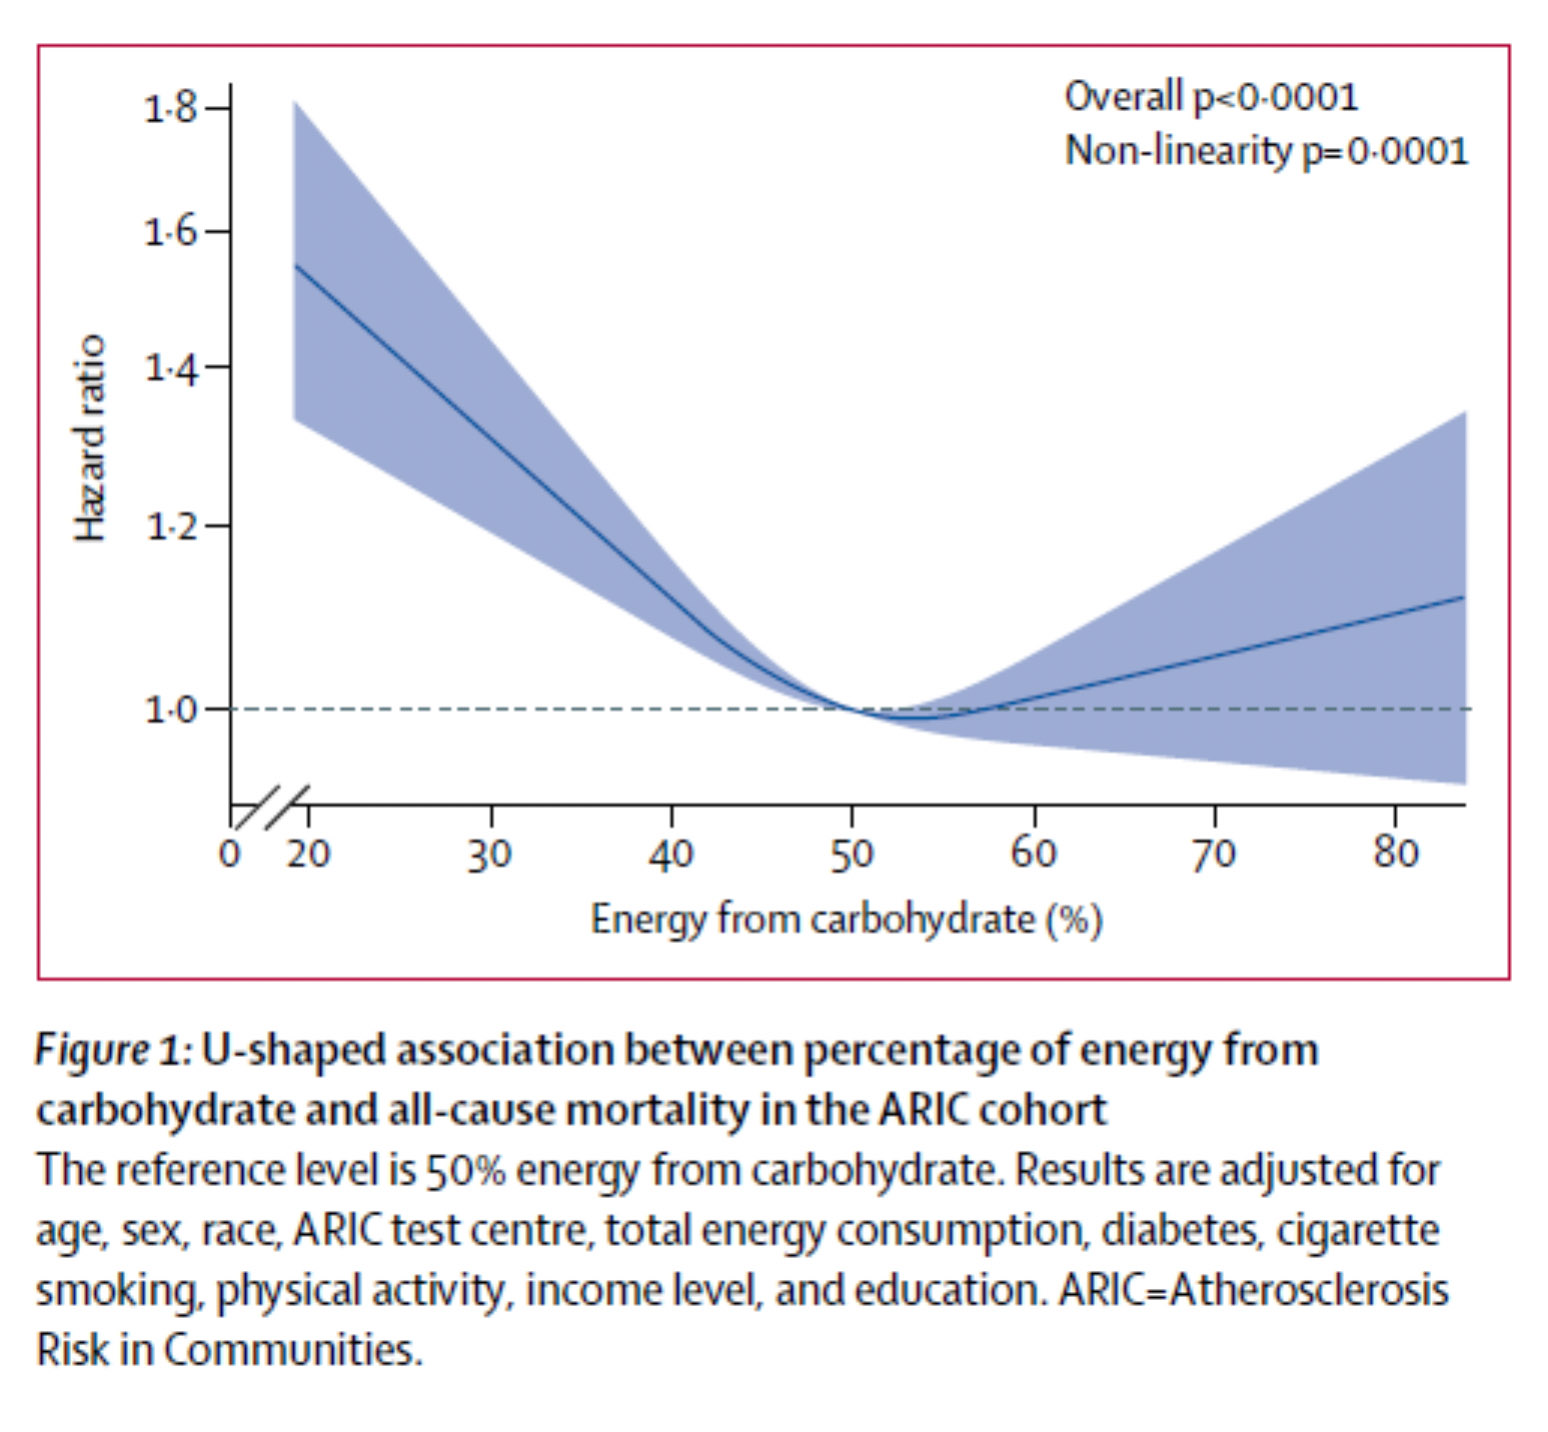
My take #3: Relative risk is different than absolute risk. If you have a 1 in 2 million chance of having something happen to you and it increased to 1 in 1 million by doing X, well you doubled you chance of having that happen to you by doing X (relative risk). But you increased your chance of having it happen to you by 0.0001%, from 0.0001% to 0.0002%. Not nearly as exciting to say that, though.
Here is their graph measuring a “hazard ratio” of all-cause mortality (on y-axis) and carbohydrate consumption (on x-axis). A Hazard ratio of 1.5 is a relative risk, meaning that mortality risk associated with low carb consumption is 1.5x higher than mortality associated with a “medium carb consumption). The authors made their graph only go up to 1.8 on the y-axis so you can see the “wild swing” from top to bottom.
My take #4: Just because it is an association trial doesn’t mean that it may not be true. Our trials about smoking and lung cancer are association trials, but there are so many trials that all point to smoking causing lung cancer that we eventually feel confident that smoking does truly increase risk of lung cancer. So if you can’t throw results away but also have to take it with a grain of salt, what do we do? We continue to look at other research. Here’s an article from Time last year http://time.com/4919448/low-fat-v-low-carb-diets/ summarizing an article that showed that high carb diets are linked to worse mortality. So one trial shows low-carb is bad, another shows high carb is bad. That would make me not put too much credence in either trial. Clearly there are some other “hidden factors” in these association studies that cannot be accounted for. Nuanced conclusions, though, do not drive clicks and traffic—either to mainstream media sites or to medical journals (Lancet, cough cough).
Eye-Catching Headline #2
No safe level of alcohol, new study concludes
Link to the article here.
Fun quotes:
“The conclusions of the study are clear and unambiguous: alcohol is a colossal global health issue” –“alcohol researcher Robyn Burton”
“At no point is there a level of consumption that appears to lower the overall risk of developing any of the wide array of drinking-related disease in comparison to non-drinking”—study author
“To minimize the risk of potential harms from alcohol, a person should have ‘zero standard drinks daily’ “
Here is a link to the full article in Lancet published August 2018
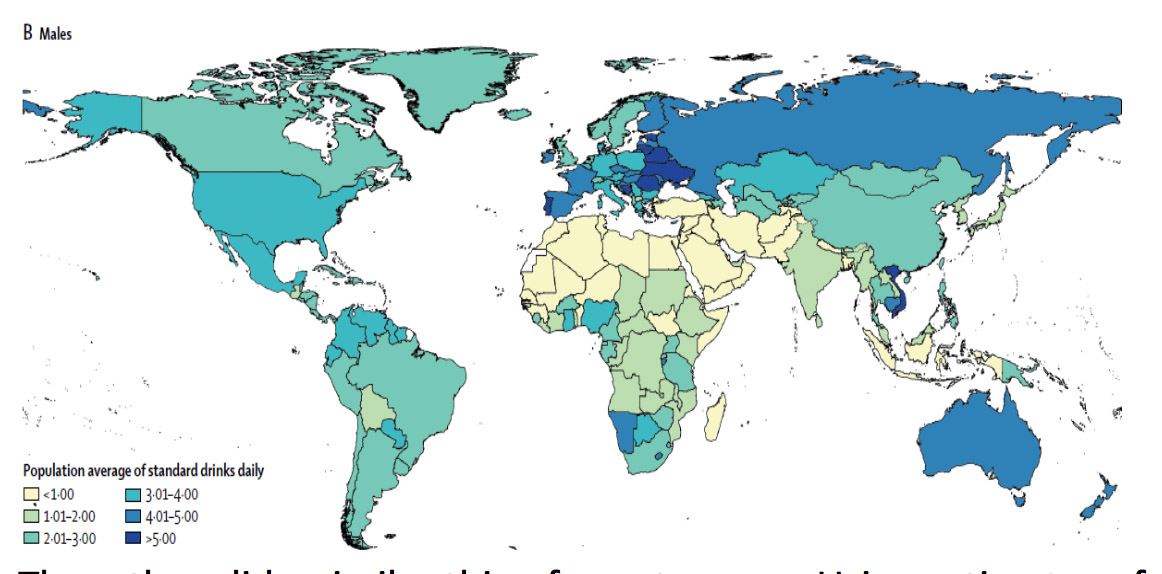
My take #1: This study is beyond my pay grade as a medical doctor to understand all the logistical modeling they did from an epidemiology standpoint. From what I can gather, they took a certain number of surveys of large #’s of specific people to determine what percent of population drinks what # of drinks daily in each global region. Then they ran large scale population numbers to figure out how much alcohol was consumed in each region through sales figures. Then they “retrofitted” to each region individual numbers of drinkers and how much they drank that was not based on individual survey data but population theory and modeling. That is how they came up with the 28 million people studied number, there were not actually 28 million people studied individually—a theoretical global population of 28 million was studied through population theory and modeling.
Then, they did a similar thing for outcomes. Using estimates of exposure and relative risks from smaller studies, they outlaid event, death, and disability rates after identifying 23 “alcohol related adverse events”. They would extrapolate this data across the world. For example, we have drunk driving rates here in the US, but nowhere else, so they assumed drunk driving rates here would be the same across the world (even in countries where people don’t drive?). The three leading causes of death attributable to alcohol in this study were tuberculosis (remember this is a global study), road injuries and self-harm. There is a lot of population estimation instead of concrete data to attribute each “alcohol related event” to a particular risk–separated by how many estimated drinks a day one theoretical person drinks.
My take #2: This is still an association, not causation study. The amount of unaccounted for variable is large considering this is a global study and a population-based study as opposed to an individual 1:1 cohort study. They tried to look at socioeconomic data, but this was only at a geographic regional level as far as I can tell. Is it the 15 drinks a day that makes you get tuberculosis, or is it that people who drink 15 drinks a day are more likely to be living in unsanitary conditions that would lead to tuberculosis?
My take #3: Relative risk is different than absolute risk.
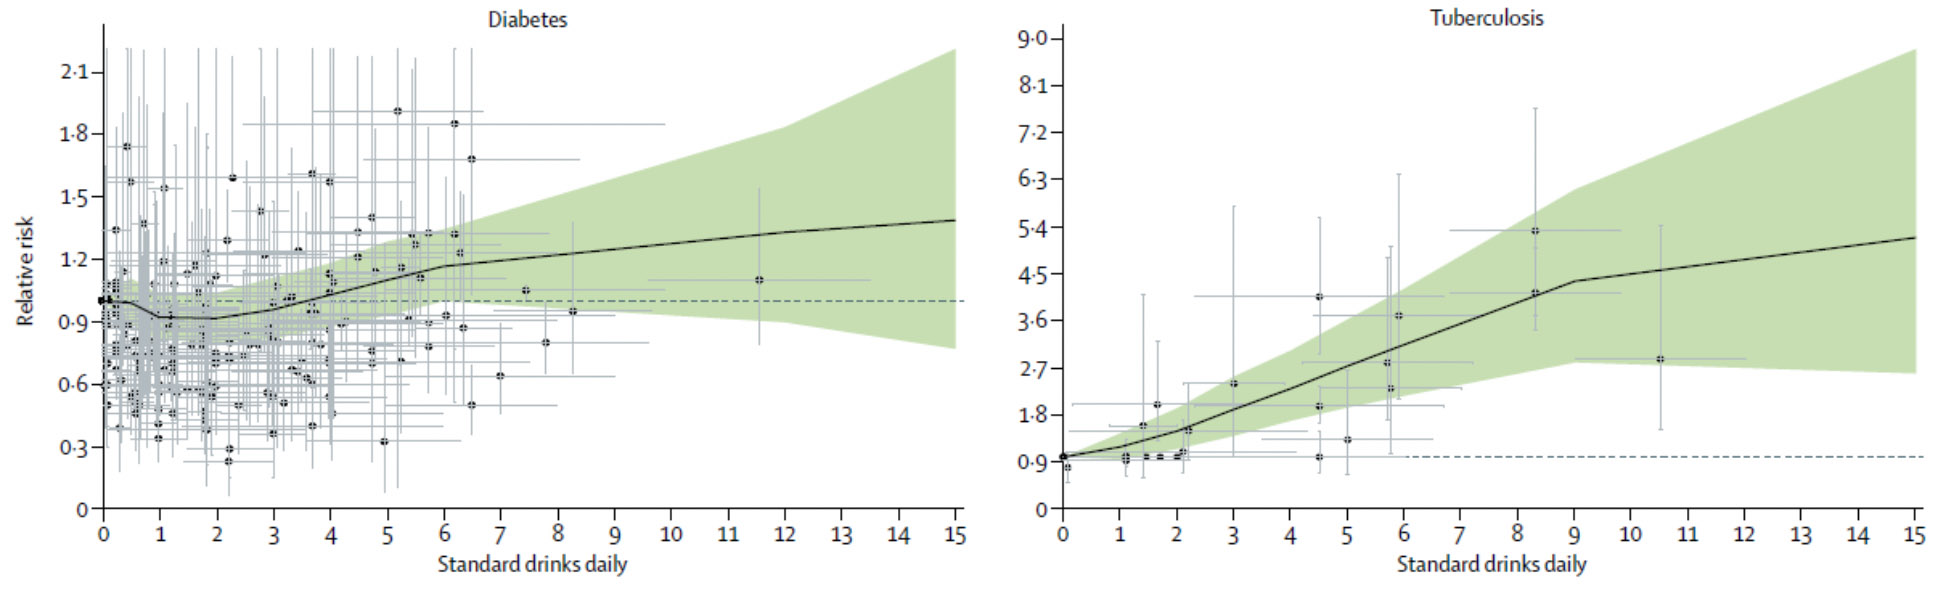
This is the data comparing alcohol drinks daily to relative risk of TB and diabetes. Both lines trend up as you drink more (well, maybe diabetes actually dips down at 1-2 drinks before going up). You would think the diabetes risk is clear cut and really bad when you get up, but the y-axis “relative risk” only goes from 1-2 all the way up. Compare that with the TB graph where it goes from 1-9. Clearly, the TB risk is much higher with drinking than the diabetes risk, but hard to tell until you squint at the graphs.
The authors’ conclusion was that drinking one drink a day may increase chance of an alcohol-related health problem by 0.5%. That may sound like a lot but given the low chance of developing an event, 2 out of 100,000 people that drink one drink a day may be associated an alcohol-related event that they maybe wouldn’t have otherwise. And even that association is found through a global population based study where they are guessing numbers of drinks and numbers of events through extrapolations.
My take # 4: You can make graphs more ominous than they are. Assuming you get past all the hand-waving and population-based estimation of both alcohol consumption and alcohol consequences, here is the money graph where most of the conclusions come from for the article. This graph plots out relative risk of disability or death from alcohol related events against the number of alcoholic drinks consumed a day.

That line starts increasing pretty quickly, doesn’t it? By the time you get to the end of the graph, it seems like everyone dies! Well yes, that is because the end of the graph is people who drink 15 drinks a day. The authors’ and media conclusions are about low alcohol consumption, but when you look at the difference in “alcohol related adverse events” from 0 drinks a day to 1 drink a day…there is no change. Even at 2 drinks a day, your relative risk is 1.1x more likely to have a global adverse event (probably much less than that in the US since we are not at risk for TB and TB drove so much of the absolute event numbers).
My take #5: The takeaway from this study is yes, alcohol is a big detractor to worldwide overall health at large consumption (3/4-15+ drinks daily). This study I don’t think was very convincing about significant health risks at low consumption. Does this mean there are not any health risks of low consumption? Certainly not, we are continuing to learn more about moderate alcohol use and both cardiovascular events (is wine protective?) and common cancers such as breast cancer (there may be some risk, difficult to piece together in studies). But again, these nuanced conclusions are not very fun to read about and certainly don’t drive traffic to media sites and medical journals.
So when we are reading headlines about medical studies, especially non-randomized trials or association-based population studies, read with a grain or two of skepticism. Not because the media or the research authors are obviously biased and trying to prove a specific point but because these trials are extremely complex to interpret and can rarely be boiled down into one or two quotes for a mainstream article. The media and culture loves wild nutrition claims, let’s just try to moderate our claims just like we should moderate our diet.